Navigating financial markets can often feel like solving a complicated puzzle, with traders constantly seeking patterns and tools to improve their strategies. Among the many chart patterns, the ABC pattern stands out as a reliable indicator of potential price reversals. When combined with Fibonacci ratios—particularly the ABC pattern .328 1.27—it offers a deeper understanding of price behavior, allowing traders to make more precise decisions.
Whether you’re a seasoned professional or new to trading, mastering the nuances of this pattern can significantly enhance your strategies. Let’s explore the fundamentals of the ABC pattern, how it aligns with Fibonacci levels, and how you can leverage these tools for optimal trading outcomes.
What Is The ABC Pattern?

The ABC pattern is a price formation that traders use to identify potential turning points in the market. It consists of three distinct points—A, B, and C—each representing a critical price movement. Recognizing this pattern helps traders pinpoint moments where price trends may reverse or continue, providing valuable insights for setting entry or exit points.
Here’s How The ABC Pattern Plays Out
- Point A: This is the starting point, often marking an initial high or low in a price trend.
- Point B: From point A, the price moves in the opposite direction, creating a retracement or correction.
- Point C: The final point represents either a continuation or a reversal of the original trend, signaling a possible buying or selling opportunity.
The ABC structure is not just about spotting trends—it also helps in minimizing emotional trading. With this pattern, traders can base decisions on clear market movements rather than speculative guesses.
However, when combined with Fibonacci ratios—specifically the .328 retracement and 1.27 extension levels—the ABC pattern becomes even more effective in predicting future price behavior.
A Brief History Of Fibonacci Ratios
Fibonacci ratios trace their origins back to the 13th century when Italian mathematician Leonardo of Pisa, also known as Fibonacci, introduced them in his book Liber Abaci. The Fibonacci sequence starts with the numbers 0 and 1, with each following number being the sum of the two preceding ones. The sequence (0, 1, 1, 2, 3, 5, 8, 13, etc.) forms the foundation for the Fibonacci ratios widely used in trading today.
These ratios, including 0.382, 0.618 (the Golden Ratio), and 1.618, are derived from the mathematical relationships between the numbers in the sequence. Beyond mathematics, Fibonacci patterns appear in nature, such as in the arrangement of sunflower seeds, the spiral of seashells, and the structure of pine cones.
In financial markets, traders found that price movements often follow these same ratios, especially during corrections and extensions. As a result, Fibonacci retracement and extension tools have become essential components of technical analysis.
Understanding Fibonacci Levels

To use Fibonacci levels in trading, you must first identify a significant price movement, such as a peak followed by a trough (or vice versa). This price swing will serve as the basis for calculating potential retracement and extension levels.
Key Fibonacci levels include:
- 23.6% – Minor retracement
- 38.2% – Common correction level
- 50% – Midpoint often considered psychologically significant
- 61.8% – Known as the “Golden Ratio” and a frequent reversal zone
- 1.27% – A popular extension level for forecasting future price targets
By applying these ratios to a price chart, traders can identify potential support and resistance levels, where the market may reverse, pause, or continue its trend.
Exploring The ABC Pattern .328 1.27 In Detail
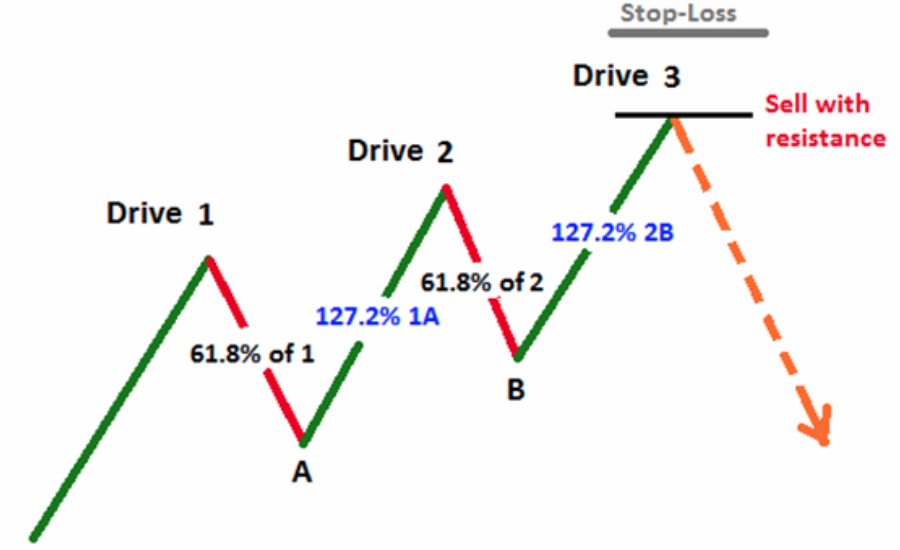
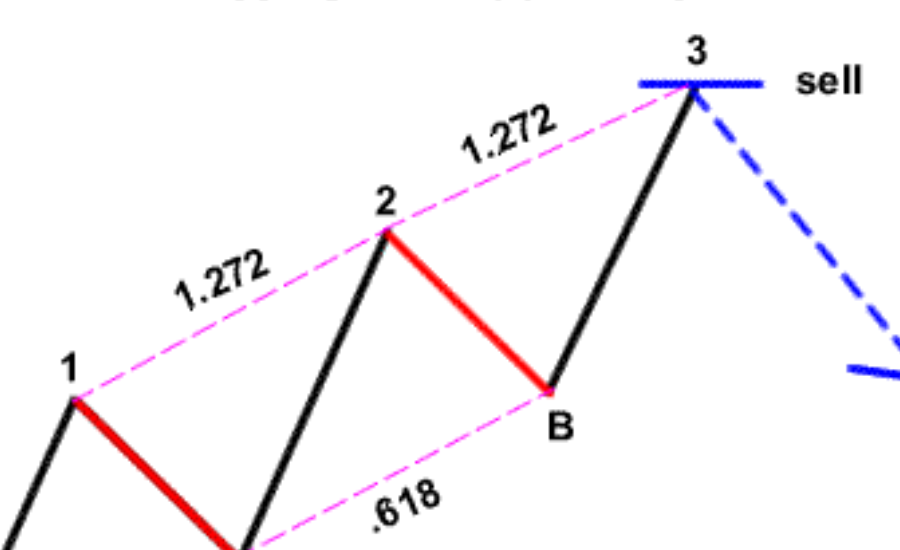
When applying Fibonacci ratios to the ABC pattern, the .328 and 1.27 levels offer unique insights. Let’s break down how these specific ratios function within the ABC pattern:
- The .328 Ratio:
- This level represents a retracement of approximately 32.8% of the initial move (from point A to point B).
- It suggests a mild pullback, where prices correct slightly before continuing their original trend. Traders often monitor this level for signs of a buying or selling opportunity, especially when the market shows signs of reversing near this retracement point.
- The 1.27 Extension:
- The 1.27 ratio forecasts an extension beyond the initial price movement by about 27%.
- When prices break beyond point C, this extension level serves as a potential target for trend continuation, helping traders determine where to exit profitable trades.
Using these ratios with the ABC structure provides traders with a more precise framework to plan their trades, particularly when navigating volatile markets. Knowing where these Fibonacci levels lie helps traders anticipate future price movements and minimize risk.
Practical Applications Of Fibonacci Ratios In Trading
Fibonacci ratios, when used effectively, can become a powerful ally in a trader’s toolkit. Here are some practical ways to apply them:
- Identifying Support and Resistance Levels:
- Fibonacci retracements help pinpoint potential reversal zones. Traders look for these levels to find entry points or to tighten their stop-loss orders.
- Forecasting Price Targets with Extensions:
- Fibonacci extensions such as 1.27 or 1.618 help estimate future price levels. These targets are useful when planning profit-taking strategies during strong trends.
- Combining Fibonacci with Other Indicators:
- Using Fibonacci levels alongside tools like moving averages or momentum oscillators adds a layer of confirmation, enhancing the accuracy of trade decisions.
- Applying Multi-Time Frame Analysis:
- Fibonacci levels on higher time frames (like daily or weekly charts) tend to be more reliable. Traders often use them in conjunction with lower time frame levels to refine their strategies for both short-term and long-term trades.
Tips For Mastering The ABC Pattern With Fibonacci Ratios
While Fibonacci ratios and the ABC pattern are powerful, their effectiveness depends on how you apply them. Here are some tips to help you integrate the ABC pattern .328 1.27 into your trading strategy:
- Align with Market Trends:
Ensure that the trend supports the Fibonacci levels you’re monitoring. A retracement at 32.8% during an uptrend, for example, signals a potential continuation.
- Use Multiple Indicators for Confirmation:
Combine Fibonacci levels with volume analysis or trendlines to validate your trade setups. The more signals that align, the stronger your trade thesis becomes.
- Be Patient and Wait for Clear Setups:
Avoid rushing into trades. Wait for the price to react near key Fibonacci levels before committing to a position.
- Analyze Historical Performance:
Keep track of how the ABC pattern .328 1.27 has performed in past trades. Reviewing these results helps you refine your strategy and adjust your approach over time.
- Adapt to Changing Market Conditions:
Markets are dynamic, so be flexible in your strategy. If price behavior deviates from the expected pattern, adjust your targets or exit early to minimize losses.
FAQs About The ABC Pattern And Fibonacci Ratios
- What is the ABC Pattern?
The ABC pattern is a three-wave structure used to spot potential reversals or trend continuations. It consists of points A, B, and C, marking key price levels in the trend.
- How do Fibonacci ratios improve the ABC Pattern?
Ratios like 0.328 and 1.27 highlight support, resistance, and price targets, helping traders identify optimal entry and exit points.
- Why are 0.328 and 1.27 ratios important?
The 0.328 ratio indicates a shallow retracement, signaling potential trade entries. The 1.27 ratio suggests price may extend beyond the previous trend, ideal for setting profit targets.
- How do I calculate Fibonacci levels?
Identify a price peak and trough, measure the distance, and multiply by key Fibonacci ratios (e.g., 23.6%, 38.2%, 50%) to locate potential support or resistance areas.
- Can Fibonacci tools work alone?
While useful, Fibonacci tools are more effective when combined with other indicators like moving averages or momentum indicators for better accuracy.
- What time frames should I use?
Use shorter time frames (e.g., 5-15 minutes) for quick trades and longer ones (daily or weekly) for broader trends and long-term strategies.
- How do Fibonacci extensions set profit targets?
After a retracement, use Fibonacci extensions (e.g., 1.27 or 1.618) to forecast potential price targets and decide where to exit trades.
- Is the ABC Pattern limited to forex?
No, it applies across various markets, including stocks, commodities, cryptocurrencies, and indices.
- What are the risks of relying on Fibonacci ratios?
Over-relying on Fibonacci levels can be risky. Sudden news or market volatility can disrupt these levels, making it essential to consider other market factors.
- How can I confirm ABC Pattern setups?
Use trendlines, volume analysis, or other indicators to validate the pattern. Multiple confirmations increase the setup’s reliability.
Conclusion
Combining the ABC Pattern with Fibonacci ratios provides traders with a reliable approach to pinpoint key price levels and make well-informed decisions. Ratios such as 0.328 and 1.27 offer valuable insights into market trends, helping traders anticipate potential price movements more accurately. However, like any technical tool, Fibonacci levels work best when complemented by other indicators and comprehensive market analysis. Whether you’re just starting or have years of experience, understanding how the ABC Pattern and Fibonacci ratios interact can significantly enhance your trading strategies. With consistent practice, patience, and a disciplined mindset, traders can uncover new opportunities and thrive in the dynamic world of financial markets.
Stay informed with the latest news and updates: Vents Breaking!

